Category Archives: Uncategorized

Three Methods for Embedding Maps

This is a guide to making maps in three different ways. The simplest way to put a google map into a post is to embed it. The second it so use Google My Maps, which lets you create markers and legend. The third is Storymap JS, which lets you tell a story about moving across a landscape.

Embedding a Google Map: Pull up any Google map, then get the embed code from Google by doing “share,” and then clicking on the embed tab behind the link tab.  Then copy the embed html code and put it in the post–but you have to click on the text tab before you paste the embed code–same as with the timeline pluggin we used before.  So now I’m gonna give that a try. This should show a map I made following Gordon Day 1998 about the boundaries of Sokoki land–Sokoki being the word he uses for what others call the Western Abenaki.

Markers and Legend into  Map: My next goal was to make a map that illustrated locations in the 1640-1665 period of conflict between the Iroquois (Haudenasonee) and the Huron, who were allied with the French.  The Huron in modern Ontario were selling fur to the French at Quebec. The Iroquois were selling fur to the Dutch at Fort Orange (Albany). For this I used the “my maps” option on Google, following a tutorial recommended by Leah Tams. You must click on the square in upper right in order to see the legend.


The green are Huron locations, the purple are French outposts, the orange are the Dutch and the blue is Ashuelot (Keene, NH), from which vantage point I consider this story.  What I wasn’t able to put on this map is the Iroquois nation, the Mahicans, and the Sokoki, so I have to work on that.  The Iroquois wanted all native New England to sell furs to them, which they would then sell to highest bidder among the Europeans.  The French refused the Huron permission to enter into that agreement, so the Iroquois destroyed the Huron, whose remnants fled to Quebec to seek refuge with the French (that’s why one market is green and purple). I made a timeline to go with the map above.

Using Storymap JS by Knightlab: But it turns out there was a tool that would have permitted me to integrate the map and the narrative more directly, called Storymap.  Since Storymap is made by the same outfit that made the Timeline JS software, it was not too difficult for me to learn to use it.  I watched a tutorial here, and then I made this below. The problem is it comes out stacked and narrow, while it is supposed to open like a book.  The solution was to put the Storymap on a PAGE rather than a POST (you are reading a POST).  To see how that fixed the situation, look here.

Source for the historical content here discussed is:
Peter A. Thomas (1990). In the Maelstrom of Change: the Indian trade and cultural process in the Middle Connecticut River Valley, 1635 to 1665. New York: Garland Publshing, pp. 204-209.

Timeline of Native Land Transfer In Your Region

Your mission: Read the required readings for your region and use them to make a timeline showing the  most important dates in land transfer in your region. To make the timeline, use a software program as shown below which lets you connect an image to each date. Then upload the timeline to your blog. Instructions follow, along with a sample. My sample has nothing to do with Native people, because I did not want to do anyone’s project for them.  It is a timeline I prepared for a different class I teach.

You will be using the Timeline JS software designed by Knight Labs.  This software permits you to upload photographs for each date, which makes it particularly beautiful. There is also a spot for you to cite the source of the photograph, a particularly important activity for a public blog. Make sure to review the following: http://coplacdigital.org/resources/guide-to-citations-copyright/.

Go to this website to start making your timeline. https://timeline.knightlab.com/, click on the tab that says, “make a timeline,” and before you do anything else, watch this video tutorial: https://vimeo.com/143407878.

Photos from the Web. The timeline video is self-explanatory, but there was one place where I ran into trouble.  One you make a copy of their google spreadsheet as they suggest, you will see that Column L is media.  If you use a photograph that is available on the web, then you right click on the image, and then scroll down to “open image in New Tab.” The new tab that opens will have a url that ends in .jpeg.  You copy and paste that url that ends in .jpeg into column L of the timeline JS.

A second issue is citing the source of the image in column M, media credit.  The image that I was interested in was of an Osage bride returning from Paris in 1725, and it is a painting in the Missouri State Capitol.  The picture is available at the Wikipedia site for Fort Orleans, a French fort on the Missouri River back in the day.  If you click on the small square underneath the image, you see that the image is from the mural of the Missouri State Capitol. The Wikipedia details also state that the image is in the public domain.  I will repeat this information in my citation.  For our class, it is important that you cite the source. If the image has a copyright on it, you cannot use it, unless you get the permission of the person who copyrighted it.

Using Your Own Photos. You can also put images from your own collection (photos you have taken, or obtained through your archival research) into the timeline.  However, you cannot upload JPEG files directly to timeline, you need a url.  The solution is to create a dropbox account, and then upload your image to the dropbox account.  Hover over the image, choose share, and then select “create a link.” Then select “copy the link,” the link will appear, and copy that link with control c and paste it into your timeline js google spreadsheet with control c.

Again, put the source of the photo, even if it is yourself.  If you obtained the photograph from the local historical society, state that society’s official name, and web address if they have one.

Publishing the Timeline on Your Blog.  Once you make complete your spreadsheet, you follow the timeline JS directions by choosing file, publish to the web.  You then close the box that appears and copy the URL of the google spreadsheet by highlighting it and using control c.  You then go to the timeline js website, choose make a timeline, and scroll down to step 3, where you paste in the URL with control v.

You can now see your timeline by scrolling down to step 4, and selecting the preview button.  That is an exciting moment, however, it is not our desired endpoint.  Rather, we wish to publish the timeline on the blog.  Please review this tutorial on how to do so: http://coplacdigital.org/resources/wp-tutorials/embedding-content/.

This exercise ground you in the turning points for native people and their land in your region.

TestingTimeline

Here’s a practice timeline. Let’s see if I can embed it.

https://cdn.knightlab.com/libs/timeline3/latest/embed/index.html?source=1Rps6_jzJ6qA6zuOPyDStLX_ZtlD5k6F__K_v87a4cYA&font=Default&lang=en&initial_zoom=2&height=650

Other idea

<iframe src=’https://cdn.knightlab.com/libs/timeline3/latest/embed/index.html?source=1Rps6_jzJ6qA6zuOPyDStLX_ZtlD5k6F__K_v87a4cYA&font=Default&lang=en&initial_zoom=2&height=650′ width=’100%’ height=’650′ webkitallowfullscreen mozallowfullscreen allowfullscreen frameborder=’0′></iframe>

Another idea

The Precontact Landscape

Your mission: to find a map showing the landscape of your college region prior to European arrival. This will be a somewhat tricky endeavor, although there is a good chance to you will stumble across a map in a book on pre-contact history, a historical atlas, or in a local museum.

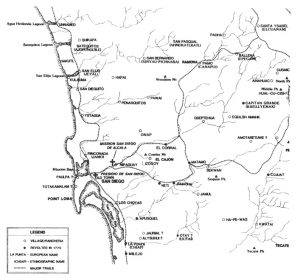
Above, the example is Richard Carrico’s map of San Diego around 1775 when the Kumeyaay participated in an uprising.  He published this in Journal of San Diego History, Vol. 43, No. 3, 1997 in an article entitled, “Sociopolitical Aspects of the 1775 Revolt at Mission San Diego de Alcala.”  This isn’t quite pre-contact, since the Spanish arrived in 1769, but it’s very close.

I learned of Richard’s work (his bio) by talking to John Johnson, who draws similar maps for the Chumash culture area from his spot at the Santa Barbara Museum of Natural History.  Something that immediately struck me about the Kumeyaay landscape is how unimportant is the port of San Diego, in contrast to the modern focus.  The big focus is on the rivers, around which are clustered the native villages. Richard told me that the word “Ja” means water in Kumeyaay and there are many towns that start with “Ja” such as “Jamacha.” Each of those places was important in this extremely dry landscape due to the water sourced there.

DUE: Nov 7

Richard Carrico's 1997 map of Kumeyaay Territory in 1775
Richard Carrico’s 1997 map of Kumeyaay Territory in 1775 (http://sandiegohistory.org/journal/1997/july/missionrevolt/)

The Town Myth

What unites most locations in the U.S. in terms of their Native history are the myths of Native Disappearance. This myth usually has two parts: 1) The first European replaces the Native people immediately and establishes firsts (church, school, cornfields, etc.) and 2) The last Native person leaves the location forever. What is the story of how the land changed hands between them? If possible, find out who, according to the town’s story,  was the first European, and who was the last Native person.

The first step in obtaining the town’s sense of its own history is to meet the reference librarians at your campus library.  Take a photograph of you together with them and make sure to get their contact info for the future.

Where to find the town’s story of how the land under your campus passed from native to US hands?  Most towns have a dusty old book that narrates the town’s history, and it is likely to sit in your campus library.  This would be a good place to start to learn the settlers’ story of Native disappearance in your area, but if you or your reference librarian find other sources, that works, too. 


Places to start searching for the town myth:

Sonoma State Campus in Rohnert Park 

Truman State University in Kirksville

UNC Asheville 

SUNY Geneseo

Keene State College

University of Farmington

Take a Look…

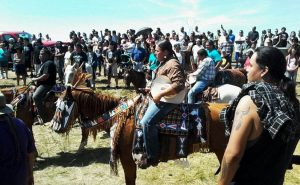
How does US society use the concept of private property to mask disposession of Native American lands? How did land get transferred from Indian hands to US society?  And mindful of the DAPL protests in our feeds, how are Indians reclaiming the land today? And perhaps the most provocative question of all, why don’t we know about conflicts between Indians and US society over the land we are literally standing on?

Our students will explore the Indian-US conflicts that underlie the communities where our colleges are located.  But this course is not like others–no paper at the end, instead a student-created web site.  And we don’t have all the answers–students will work in pairs to uncover which Indian communities held the land underneath their college towns and how it got transferred.  We will show how to do archival work with case studies of the Wampanoag in Plymouth Plantation, and the Kumeyaay in San Diego.

Source: Odyssey, https://www.theodysseyonline.com/outcry-standing-rock
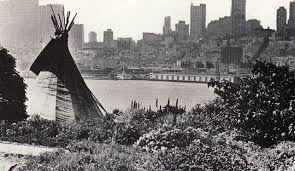
Teepee in front of San Francisco Skyline
Indians occupy Alcatraz in 1971. Source: http://alcatrazinterns.tumblr.com/post/39683602346/transplantproject-rise-radical-indigenous